
Employee benefits are exactly what they say on the packet: perks that reward your team for choosing you as their employer and doing good work.
But for a programme to be truly effective, the benefits must stretch to the company too.
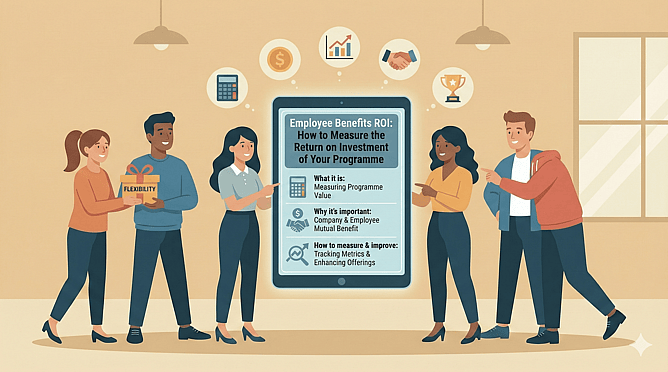
In this guide we'll break down employee perks ROI: what it is, why it's important, and how to measure and improve yours.
What is employee perks ROI?
Employee perks ROI is the process of measuring how much of a return is generated by your investment in a workforce benefits programme.
There are a number of compelling reasons for a Kiwi organisation to set up an employee benefits programme:
To attract and retain top talent
To get employees more engaged with their employer and their work
To incentivise and enhance performance
But the only way to know whether you are achieving these aims is to measure and analyse the effectiveness of your programme. By tracking key metrics and generating insights, you can tweak and optimise your programme to increase the ROI it delivers over time.
Why measuring ROI matters
Measuring employee perk ROI matters because it's the only way to know whether your programme is effective, or whether you're pouring money down the drain.
Offering incentives to your workers - whether cost-of-living assistance, health benefits, discounts or work flexibility - can drive a wealth of advantages for your organisation. It can enhance employee satisfaction, loyalty, productivity and morale. It can also enhance your employer brand, making you a destination of choice for top talent.
By measuring the return on your investment in an employee benefits package, you can maximise its effectiveness and ensure that for every dollar you spend, you generate multiple dollars in return - making it a win-win for all involved.
Key employee benefit metrics to track
Now that we understand the why of perks ROI, it's time to address the how. The effects of employee benefits can sometimes be difficult to measure, but by tracking key metrics you can get a good sense of the return your investment is generating.
Cost-based metrics
These hard numbers provide the baseline for your ROI calculations. They allow you to understand where your bPeople-based metrics
People-based metrics help you connect your spend to tangible shifts in behaviour - the type that drive long-term revenue generation and cost savings within your organisation.
Retention: By comparing the turnover of employees who engage with the programme versus those who don't, you can see how much it contributes to talent retention.
Engagement: This metric uses 'engagement surveys' to measure how committed an employee is to your organisation. By including questions about the perks program you can get a sense of how much it is contributing to engagement.
Absenteeism: This metric tracks the number of days employees are away from work udget is going and how efficiently it is being spent.
Total benefits spend: Your gross monthly or annual investment in the programme, including direct payouts, third-party subscription fees, internal admin costs and taxes.
Cost per employee: Calculated by dividing your total benefits spend by your total headcount. Essential for financial forecasting and ensuring your programme can scale with your business.
Utilisation: The percentage of your workforce that capitalises on perks. High spend on unutilised benefits suggests that the money could be better allocated elsewhere.
due to illness or burnout. Effective wellbeing and mental health perks can help to reduce absenteeism in your workplace.
Productivity: While trickier to isolate, you can look for correlations between specific benefits (e.g. flexible working or mental health support) and overall output or performance review scores.
Qualitative metrics
To measure and improve employee benefit ROI, you can't just look a the hard numbers; you also need to capture the feeling, the vibe. Qualitative metrics provide the context behind the data and can tell you why certain perks might be succeeding or failing.
Satisfaction surveys: Targeted questionnaires designed to gather specific feedback on your benefits. Employees can rank individual perks, helping you identify which are most valued and which can be removed or replaced.
eNPS (Employee Net Promoter Score): This metric is based on a simple question: "on a scale of 0 to 10, how likely are you to recommend this company as a place to work?" eNPS is a powerful indicator of culture, and high-quality perks programmes typically correlate with higher eNPS scores.
How to calculate programme ROI
Calculating the ROI of your corporate perks programme allows you to justify your budget and refine your strategy.
The ROI formula
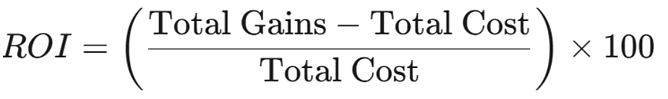
The formula for employee perk ROI is relatively simple:
As an example, let's say a mid-sized firm has the following numbers:
Total perk programme cost: $40,000 (including software, admin, taxes and funding the perks)
Estimated gains: $100,000 (calculated via reduced recruitment fees from lower turnover or decreased sick leave costs)
Finding the programme ROI is a simple matter of taking the total cost from the total gains – which in this case would equal $60,000 – then dividing that by the total cost and multiplying by 100:
($60,000 / $40,000) x 100 = an ROI of 150%.
In this scenario, for every $1 spent on the perks programme, the company receives $1.50 in return. Anything above $1 is a win, and the higher the figure, the better the programme is for business.
The tricky bit isn't the calculation, it's finding the numbers to plug into this formula.
A step-by-step measurement framework
How do you generate accurate data on costs and gains? The short and rather annoying answer is it depends. 'Gains' can mean different things to different businesses. Some programmes are easier to measure than others. Large businesses with dedicated HR teams are better equipped to do this work than smaller operations.
That said, the following general approach is a great place to start your ROI measurement journey.
Set clear objectives: Before you look at a single spreadsheet, define what success looks like for your organisation. You might want a 10% reduction in employee turnover, a 25% surge in productivity, a two point increase in eNPS score. Specificity helps you choose the right metrics to track, and craft programmes that target those goals.
Gather baseline data: You need to begin with a baseline. Crunch data from the last 12 months: turnover, absenteeism and average recruitment costs. Run an eNPS survey to capture current team sentiment. This work creates the benchmark that you can measure future gains against.
Track over time: Accurate ROI reporting is about consistency. Measure metrics regularly, ideally monthly. This real-time visibility allows you to spot trends – say a drop in the utilisation of a mental health programme – and intervene before your investment goes to waste.
Analyse the impact: Finally, generate actionable insights from your data. If you see that employees who take advantage of flexible working have 20% fewer sick days than those who don't, that suggests a direct link between work flexibility and productivity. You should then attempt to calculate the ROI of said perk using the formula above, to help you make educated decisions regarding your programme.
Tools and best practices
In order to transform raw data into a compelling ROI narrative, you need help from the right tech. Managing multiple spreadsheets is tricky, time-consuming work that is prone to error, so look for tools that automate the admin and centralise your reporting.
Take 1Team: an all-in-one perks hub. Rather than juggling separate vendors, the 1Team platform allows you to manage exclusive discounts, custom company perks and internal communications through a single, tailored app. This centralisation makes it easy to track utilisation and engagement rates in real time. It gives you the visibility you need to prove your programme's value.
Alongside 1Team, the following tools and best practices can help you get a handle on the returns delivered by your corporate perks programme:
Pulse survey platforms: Use simple survey tools to send short monthly surveys to track the mood of your crew and to understand their thoughts on and uptake of your programme.
Visual dashboards: Feed in data on costs, employee engagement and gains into a business intelligence tool or a dedicated HR dashboard that can convert zeroes and ones into visuals like graphs, that make it simple to track trends over time.
Regular feedback loops: Don't wait for annual reviews or exit interviews to ask for feedback. Keep communication lines open, asking employees for their thoughts regularly through internal comms or digital suggestion boxes, ideally anonymously to encourage honesty.
Common challenges and solutions of perk ROI measurement
Measuring the value of a benefits programme is rarely simple or a straight line. Between fickle human sentiment and shifting market conditions, it can sometimes feel like trying to nail jelly to a wall. That said, there are ways to jump the most common hurdles.
Challenge: The attribution gap
It is notoriously difficult to prove that a specific perk – such as a gym membership – was the sole reason an employee decided to stay. Other factors like management style, salary increases and career progression are likely to have also played a role, no matter how small.
Solution: Instead of looking for a single smoking gun, look for correlations. Compare the retention rates of employees who actively use your 1Team perks against those who do not. If the power users have a significantly lower turnover rate, you have a strong case for attribution.
Challenge: Data fragmentation
Information is often scattered across different tools: payroll systems, HR platforms, spreadsheets and more. This makes it tricky to gain a clear view of ROI.
Solution: Use an all-in-one hub like 1Team to house your discounts and internal perks to create a single source of truth. This reduces the manual labour required to pull reports and ensures your numbers are accurate.
Challenge: Long-term vs short-term effects
Some perks like freebies bring an immediate impact, while others like mental health support or financial wellness can take months or even years to show their worth through reduced absenteeism or higher productivity.
Solution: Distinguish between leading and lagging indicators. Leading indicators, like perk platform logins and claim rates, tell you if the programme is healthy in the short term. Lagging indicators, like annual turnover and eNPS, show long-term impacts.
Your perk programme should generate a return. With the help of 1Team, it will.
Measuring the ROI of your benefits programme is about more than just justifying a budget – it is about understanding the health and happiness of your most valuable asset: your people.
When you track the right metrics and use the right tools, you move from gut feel and guesswork to strategic insights and data-driven decision making. As a result, you can build a benefits package that truly resonates with your workforce and drives real results within your business.
Ready to craft a difference-making employee benefits scheme? Explore the 1Team platform today and discover how we can help you build a more engaged and productive team.